
Massachusetts State Fiscal Condition
#49 rank by Mercatus Center
Eileen Norcross Director for the State and Local Policy Project
Olivia Gonzalez Research Associate, SLPP
Key materials
Summary
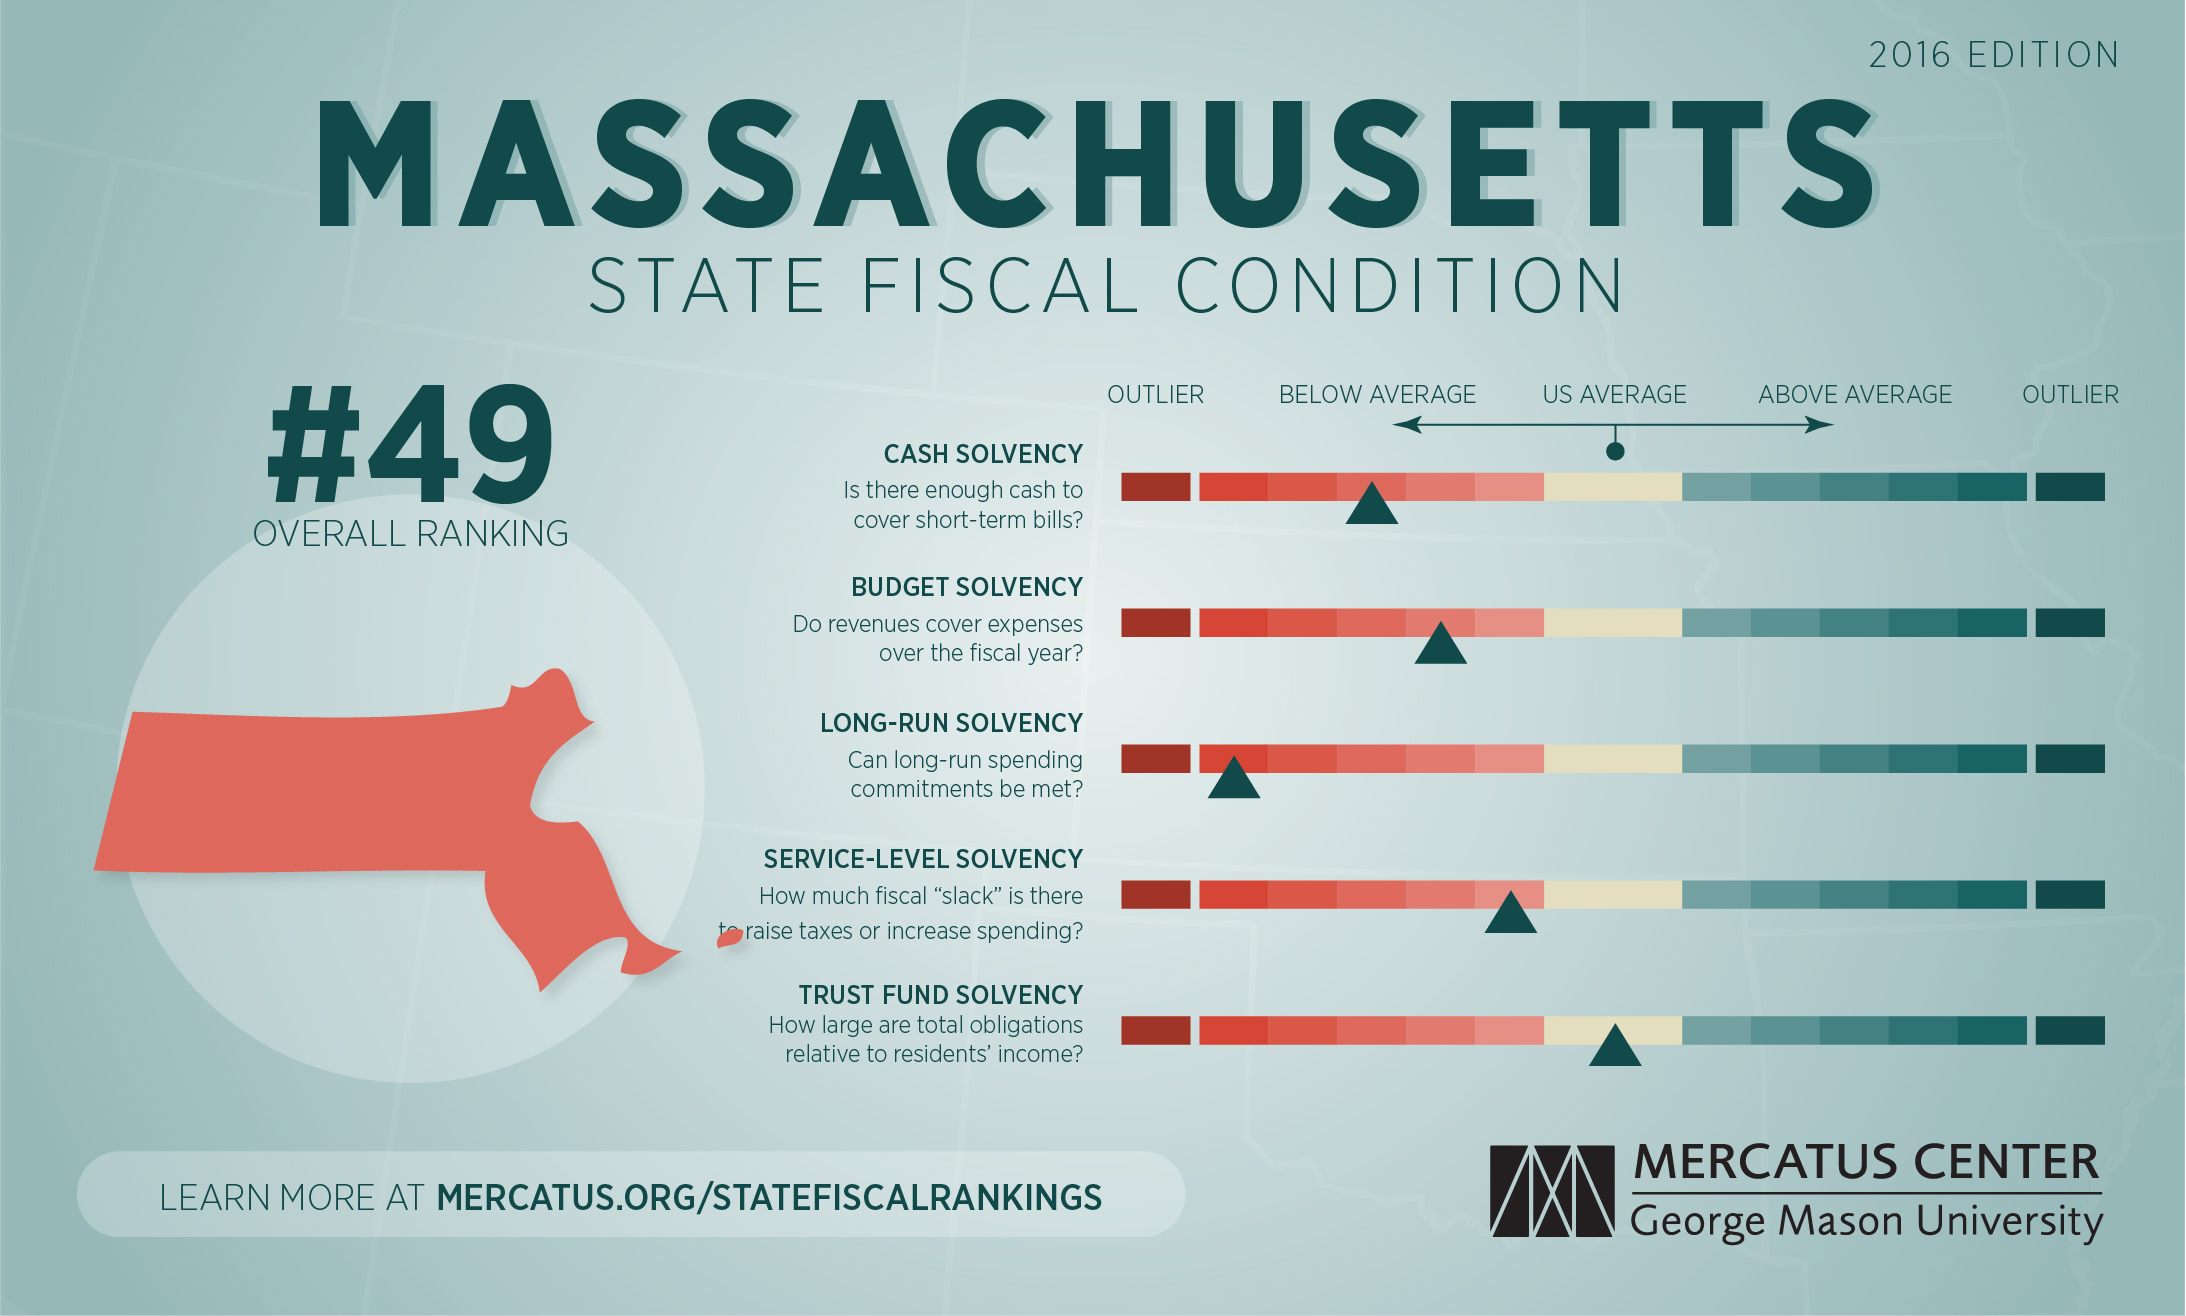
On the basis of its fiscal solvency in five separate categories, Massachusetts ranks 49th among the US states and Puerto Rico for its fiscal health. On a cash basis, Massachusetts has between 0.39 and 1.12 times the cash needed to cover short-term liabilities. Revenues cover 96 percent of expenses, producing a deficit of $342 per capita. The state is reliant on debt financing, with a negative net asset ratio of −0.94 and long-term liability per capita of $6,237. Total liabilities exceed assets by 53 percent. Total debt is $26.73 billion. Unfunded pension liabilities are $94.45 billion on a guaranteed-to-be-paid basis, and other postemployment benefits (OPEB) add $15.38 billion.
Key Terms
For more data on your state, including indicators such as pension liabilities and state debt, click “Download the PDF.”
.pdf :


On the basis of its fiscal solvency in five separate categories, Massachusetts ranks 49th among the US states and Puerto Rico for its fiscal health. On a cash basis, Massachusetts has between 0.39 and 1.12 times the cash needed to cover short-term liabilities. Revenues cover 96 percent of expenses, producing a deficit of $342 per capita. The state is reliant on debt financing, with a negative net asset ratio of −0.94 and long-term liability per capita of $6,237. Total liabilities exceed assets by 53 percent. Total debt is $26.73 billion. Unfunded pension liabilities are $94.45 billion on a guaranteed-to-be-paid basis, and other postemployment benefits (OPEB) add $15.38 billion.
Key Terms
- Cash solvency measures whether a state has enough cash to cover its short-term bills, which include accounts payable, vouchers, warrants, and short-term debt. (Massachusetts ranks 50th.)
- Budget solvency measures whether a state can cover its fiscal year spending using current revenues. Did it run a shortfall during the year? (Massachusetts ranks 48th.)
- Long-run solvency measures whether a state has a hedge against large long-term liabilities. Are enough assets available to cushion the state from potential shocks or long-term fiscal risks? (Massachusetts ranks 48th.)
- Service-level solvency measures how high taxes, revenues, and spending are when compared to state personal income. Do states have enough “fiscal slack”? If spending commitments demand more revenues, are states in a good position to increase taxes without harming the economy? Is spending high or low relative to the tax base? (Massachusetts ranks 31st.)
- Trust fund solvency measures how much debt a state has. How large are unfunded pension liabilities, OPEB liabilities, and state debt compared to the state personal income? (Massachusetts ranks 20th.)
For more data on your state, including indicators such as pension liabilities and state debt, click “Download the PDF.”
.pdf :


when you have a state run by the dems, that's what you get.
ReplyDeleteHow about Templeton are we 350 out of 351
ReplyDelete$95 Billion in unfunded pension liability. Public sector pensions are unaffordable. More than 1/4 of MBTA workers made six figures last year. Many public pensions are based on the highest three years of earnings, not the average earnings across the worker's term of employment. The raises that were just passed for "legislative leaders" will boost the retirement of our "unindicted co-conspirator" Speaker DeLeo and Senate President Stan Rosenberg. They are both 67, so the legislature passed an "emergency preamble" to make the raises effective immediately.
ReplyDelete